Simply taking a look into the metrics provided by Google Ads, Bing Ads, and Facebook Ads does not allow you to evaluate the effectiveness of paid advertising campaigns. To learn more about why PPC advertisement depends on understanding the rest of your user journey marketing data, read on.
As we approach the end of the year, it’s a good time to reflect on what has changed in the marking space this year. Agencies are spending more money on paid advertisement – but is it producing the right kind of return?
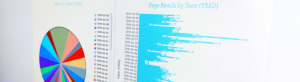
This is a tough question to answer without visibility into key data organized to show the whole picture. The right user journey marketing tool combines data from multiple platforms to produce enlightening digital marketing dashboards. At a glance, these dashboards show what ad copy and which keywords result directly in revenue generated.
Click-Through-Rate Is Just The Beginning Of The Story
Click-through rate (CTR) metrics show PPC specialists and marketing managers what percentage of people who see their ads click through to their website. It’s easy to mistake this as the end-all be-all metric for evaluating the effectiveness of paid ads.
However, just because a user clicks through to your website doesn’t mean they will purchase a product or service. If you are getting a high percentage of clicks to your website but no conversions, CTR is not as important because the ads aren’t producing any revenue.
The quality of the clicks is more important. Your ads should attract people who are likely to buy, which is a factor you have control over. The keywords you are paying to present your ad for for will determine the quality of your clicks.
Key Metrics Work Together To Show The Effectiveness Of Ads
Unfortunately, PPC reporting tools don’t give a clear picture of whether you are choosing the right keywords or displaying the right ad copy. They can show whether your ads are getting clicks, and if certain keywords are earning any clicks. But the limitation is in proving whether the users that click to your website are converting.
You can optimize your keywords to attract users who are interested in the value your company offers. But to do so, you need a user journey reporting tool like Optix.
Optix offers omnichannel reporting in the sense that it mashes data from multiple platforms into a cohesive picture of marketing performance.
Money Spent Vs. Revenue Generated
A significant amount of money is going to paid advertisement in the paid advertisement space. Marketers need to know how the cost per click translates into web consideration and conversions. Optix shows you which ad copy and keywords produce conversions when clicked.
By showing PPC data alongside other user journey data, such as metrics from websites and conversion forms, Optix produces crystal-clear insights into what’s working and what’s not in ad campaigns. With Optix, you can draw direct conclusions about whether a specific keyword or ad copy results in conversions.
This data is displayed in a clear visual format, and the only work required upfront is to integrate the tools you already use.
If you have the sense your PPC campaigns could be optimized to produce a higher return, you need Optix to inform your efforts with data. Optix is easy to set up and produces intuitive digital marketing dashboards automatically. It updates your reports on a running basis, so you don’t need to assign the task of creating reports on a routine basis to someone from your team. Instead of spending hours of time compiling data, let Optix do the heavy lifting.
Want to learn more about Optix? Visit www.optix.ai.